
7 Referral Management Metrics That Drive Practice Growth
Referral management metrics show whether a referral becomes a scheduled and completed appointment—not simply whether it was sent or received. The most useful metrics reveal where patients stall, how quickly teams respond, whether care stays within the appropriate network, and how referral performance affects access, staff capacity, and revenue.
Many medical practices can report monthly referral volume. Far fewer can answer questions such as:
- How many referred patients scheduled and completed care?
- How long did it take to contact and schedule each patient?
- Where did referrals stall or leave the preferred network?
- Which referral sources generated completed appointments?
- How much staff time did each referral require?
That gap between counting referrals and measuring outcomes is where delayed care, administrative waste, and lost revenue can hide. A structured referral management process gives teams the visibility needed to find those gaps and improve them.
What Are Referral Management Metrics?
Referral management metrics are key performance indicators (KPIs) that measure the speed, quality, completion, and financial impact of a patient referral workflow. They follow the referral across the full lifecycle—from receipt or creation through patient outreach, scheduling, the completed visit, and communication back to the referring provider.
This closed-loop approach matters because a referral is not complete when it is transmitted. It is complete when the patient receives the intended care and the appropriate information returns to the care team. The Agency for Healthcare Research and Quality (AHRQ) has highlighted closed-loop referral processes as an important patient-safety practice.
Why Referral Leakage Matters
Referral leakage occurs when a patient does not complete the intended next step or receives care outside the preferred network without a clinical or patient-choice reason. It may result from missing documentation, delayed outreach, insurance barriers, scheduling friction, poor status visibility, or a breakdown in provider communication.
Leakage should not be treated as a single percentage without context. Practices should separate:
- Process leakage: the referral stalls before scheduling or completion.
- Network leakage: the patient receives care outside the preferred network.
- Clinically appropriate out-of-network care: the required service is unavailable in-network or a different destination is medically necessary.
- Patient-directed choice: the patient knowingly selects another provider.
This distinction is especially important for accountable care organizations (ACOs) and clinically integrated networks (CINs). The objective is not to restrict patient choice; it is to identify avoidable friction, improve care coordination, and understand whether the network can meet patients’ needs.
The 7 Referral Management KPIs to Track
| Metric | What It Measures | What It Can Reveal |
|---|---|---|
| Referral completion rate | Percentage of eligible referrals that result in completed care | Overall effectiveness of the referral pathway |
| Time to first contact | Time from referral receipt to the first documented patient outreach | Intake delays and staffing or queue problems |
| Referral-to-appointment conversion | Percentage of eligible referrals that become scheduled appointments | Outreach, eligibility, and scheduling friction |
| Time to schedule | Time from referral receipt to a confirmed appointment | Access constraints and workflow bottlenecks |
| Appointment completion rate | Percentage of scheduled referral appointments that are completed | No-shows, cancellations, and reminder gaps |
| Network leakage rate | Percentage of eligible referrals completed outside the preferred network | Access gaps, directory issues, and network adequacy |
| Closed-loop communication rate | Percentage of completed referrals with a consult result or status returned | Provider communication and continuity-of-care gaps |
1. Referral Completion Rate
Referral completion rate is the percentage of eligible referrals that result in the intended service or specialist visit being completed.
Formula: Completed referrals ÷ eligible referrals × 100
Define the denominator carefully. Exclude duplicates, referrals canceled for valid clinical reasons, and patients who decline care after informed outreach. Segment the rate by specialty, location, payer, urgency, and referral source. One organization-wide average can conceal a high-performing service line and a struggling one.
2. Time to First Patient Contact
Time to first contact measures how quickly the receiving team initiates outreach after receiving a referral. Track both the median time and the percentage contacted within your organization’s service-level target.
The median is usually more useful than the average because a small number of very old referrals can distort an average. Teams should also distinguish an outreach attempt from successful contact. Both are useful, but they answer different operational questions.
3. Referral-to-Appointment Conversion Rate
This KPI measures how many eligible referrals become scheduled appointments.
Formula: Scheduled referrals ÷ eligible referrals × 100
Compare conversion with completion. If conversion is low, examine intake, insurance verification, patient outreach, and scheduling availability. If conversion is high but completion is low, investigate reminders, transportation, appointment lead time, and cancellation recovery. Automated patient communications can support consistent outreach and follow-up across the referral journey.
4. Time to Schedule
Time to schedule measures the interval between referral receipt and a confirmed appointment. Track the median, the 90th percentile, and performance by urgency level. A routine referral and an urgent referral should not share the same target.
Long scheduling times may point to missing clinical records, delayed eligibility checks, prior authorization requirements, limited appointment supply, or repeated call attempts. A real-time work queue makes it easier to identify referrals approaching their service-level limit before they become overdue.
5. Appointment Completion Rate
Appointment completion rate shows how many scheduled referral appointments result in a completed encounter.
Formula: Completed appointments ÷ scheduled referral appointments × 100
Track no-shows, patient cancellations, provider cancellations, and rescheduled appointments separately. Each outcome requires a different response. A no-show recovery workflow, for example, should return the patient to an active queue instead of allowing the referral to disappear from reporting.
6. Network Leakage Rate
Network leakage rate measures how often eligible referrals leave an organization’s preferred provider network.
Formula: Eligible out-of-network referrals ÷ all eligible referrals × 100
For ACOs and CINs, this metric is most useful when paired with a reason code. Common reasons include unavailable specialty, excessive wait time, insurance mismatch, inaccurate directory data, geographic access, patient preference, and clinical necessity. The metric should guide network improvement—not override beneficiary choice or clinical judgment.
7. Closed-Loop Communication Rate
This KPI measures whether the referring provider receives the referral status and appropriate clinical information after the visit.
Formula: Completed referrals with results returned ÷ completed referrals × 100
Outpatient referrals often cross organizational and technology boundaries. Research has documented communication breakdowns between primary care clinicians and specialists, reinforcing the need to track whether referral information and consult results actually reach the intended recipient. See the peer-reviewed study on communication breakdown in the outpatient referral process.
Where Referral Workflows Commonly Break Down
Most failed referrals can be traced to one or more operational breakpoints:
- Intake: A referral arrives incomplete, unread, duplicated, or routed to the wrong queue.
- Clinical review: Records or diagnostic results are missing, delaying triage.
- Eligibility and authorization: Coverage requirements are discovered too late.
- Patient outreach: Contact begins late or relies on one unsuccessful phone call.
- Provider matching: Specialty, insurance, location, or availability information is inaccurate.
- Scheduling: Limited availability or repeated handoffs prevent confirmation.
- Appointment follow-through: Reminders, cancellation recovery, or transportation support are insufficient.
- Loop closure: The consult status or clinical note never returns to the referring team.
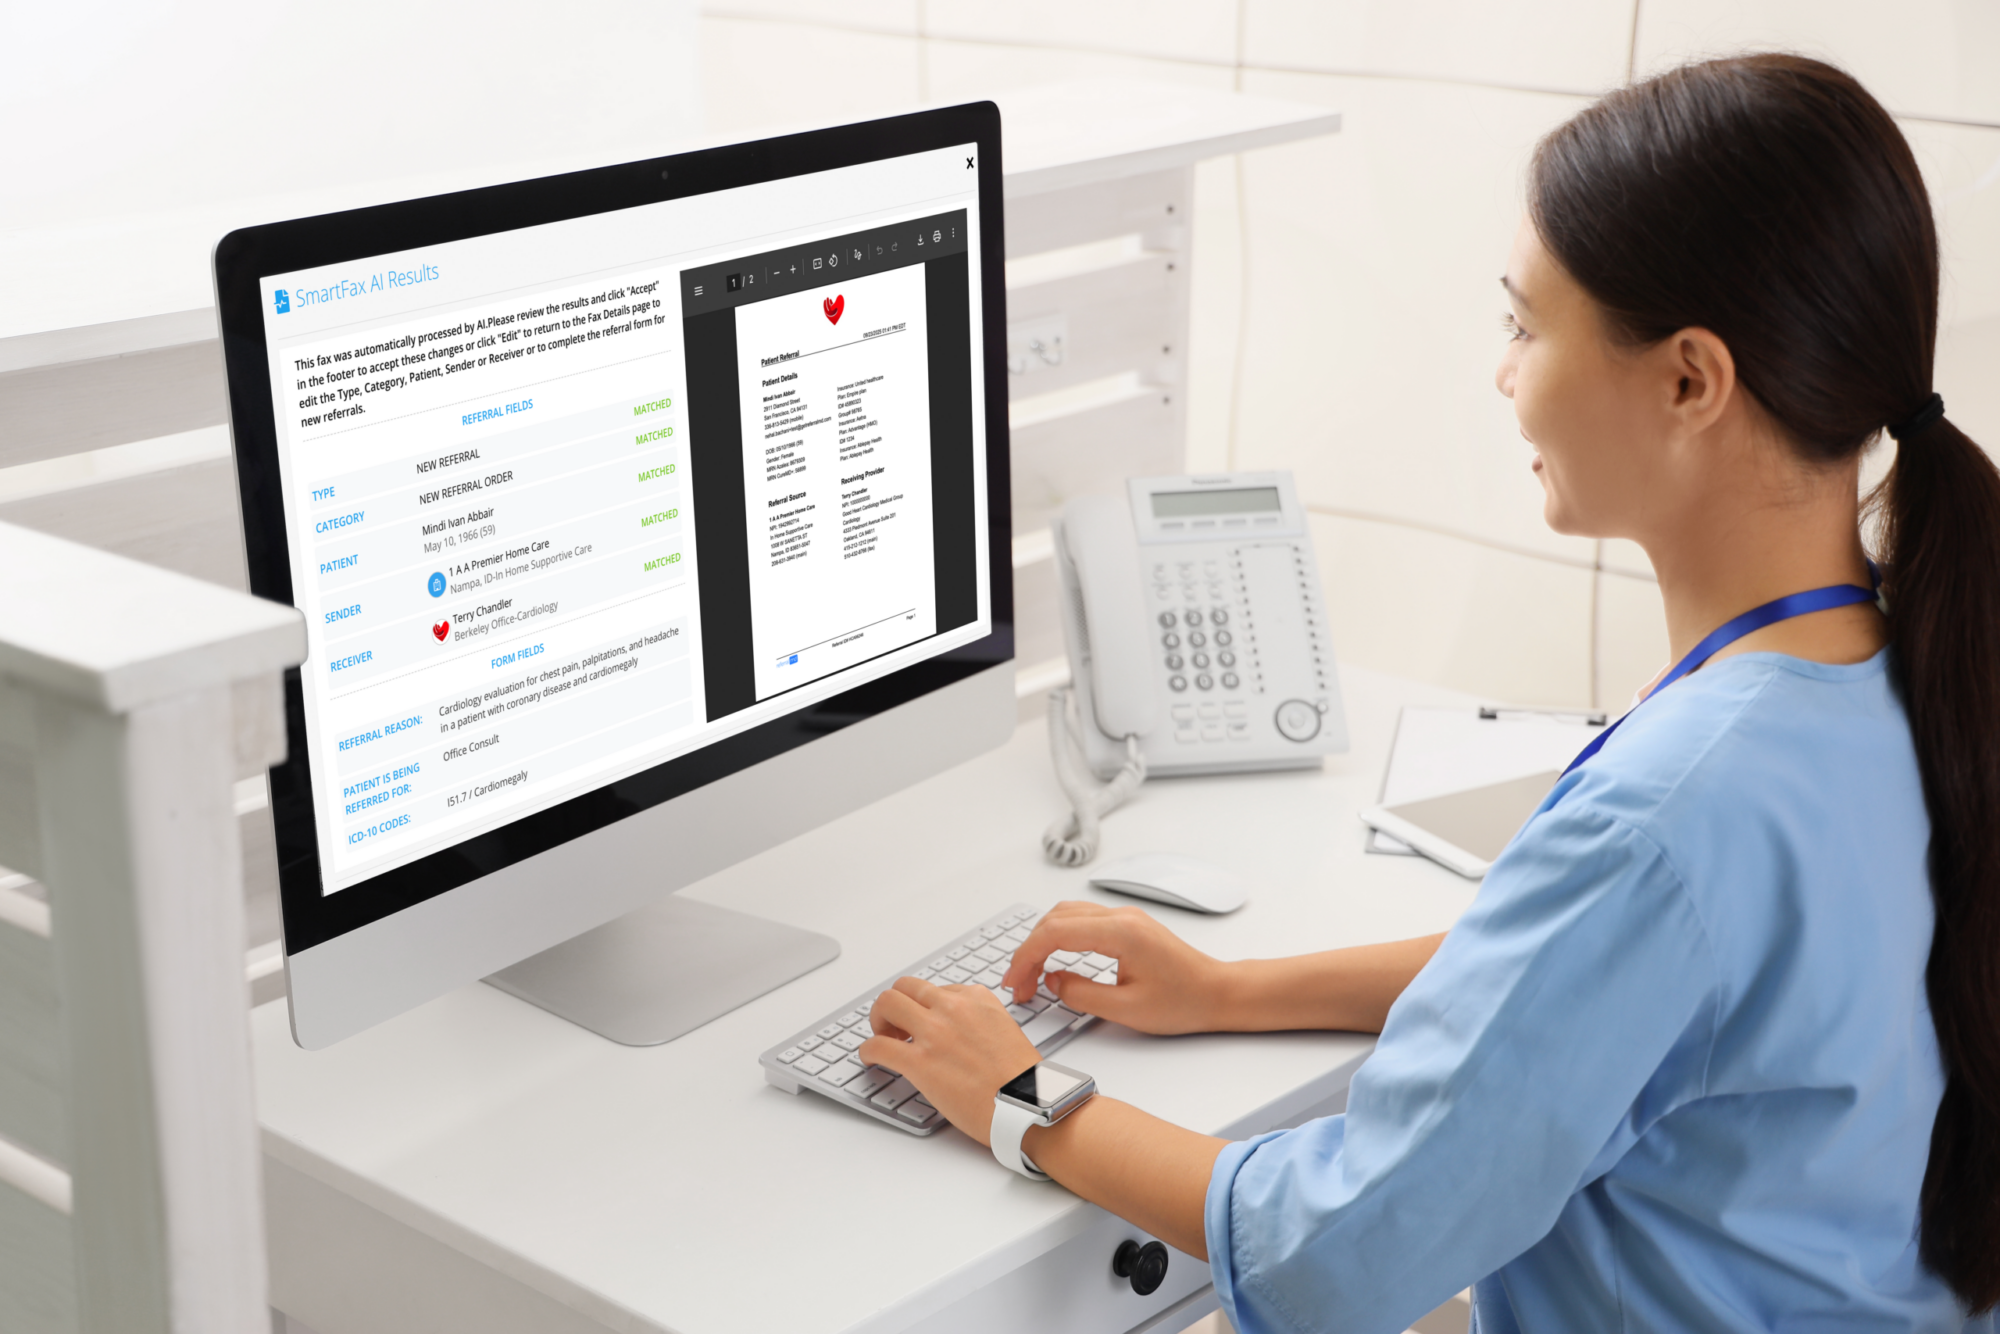
Digital tools should reduce these handoffs rather than add another disconnected queue. For example, AI-enabled fax management can classify and route incoming documents, while referral analytics can show which statuses, locations, or service lines accumulate delays.
How ACOs and CINs Should Measure Referral Performance
Practice-level KPIs focus on whether an individual patient reaches care. ACO and CIN reporting must also show how referral performance varies across the network. Useful network-level views include:
- Completion and time-to-schedule by organization, specialty, provider, and location
- In-network utilization by service line and geography
- Top reasons for avoidable out-of-network referrals
- Referral volume compared with available appointment capacity
- Timely follow-up for high-risk or recently discharged patients
- Closed-loop communication across participating organizations
- Equity measures segmented by language, geography, payer, or other appropriate populations
CMS’s ACO Care Coordination Toolkit emphasizes systematic care coordination, data sharing, patient engagement, and transitions across settings. Referral metrics can provide the operational layer that helps an ACO see whether those coordination processes are working day to day.
A relevant ReferralMD example is Innovation Care Partners, an ACO and clinically integrated network that implemented a referral management platform across hundreds of network organizations. For enterprise teams, the lesson is that standardized status definitions and consistent workflows are prerequisites for comparable network-wide reporting.
How to Calculate the Financial Impact of Referral Optimization
Connect operational improvement to financial performance with a transparent model. Avoid presenting every incomplete referral as guaranteed lost revenue; some patients decline care, become ineligible, or appropriately receive care elsewhere.
Illustrative opportunity formula:
(Eligible incomplete referrals × realistically recoverable percentage × average net contribution per completed referral) − incremental operating cost
For example, assume a specialty practice receives 200 eligible referrals per month, 50 do not reach a completed appointment, and the team believes process improvements can realistically recover 20% of those incomplete referrals. If the average net contribution per completed referral is $400, the estimated monthly opportunity is:
50 × 20% × $400 = $4,000, before subtracting any incremental cost.
This is an operational estimate, not a revenue guarantee. Finance leaders should use the organization’s own collections, contribution margin, payer mix, procedure mix, and downstream utilization data.
How to Build a Referral KPI Dashboard
A useful dashboard should help staff act, not merely report history. Start with a small number of metrics and define each one in a data dictionary.
- Establish the baseline. Measure at least one representative reporting period before setting targets.
- Standardize statuses. Define received, under review, patient contacted, scheduled, completed, canceled, declined, and closed.
- Assign owners. Every stalled status should have a responsible team or role.
- Create service-level targets. Segment them by urgency, specialty, and referral type.
- Add reason codes. Use structured reasons for delays, closure, and out-of-network care.
- Review trends by segment. Examine location, provider, specialty, payer, and referral source—not only the overall average.
- Pair lagging and leading indicators. Completion is a lagging outcome; time to contact and aging referrals are leading indicators teams can change today.
ReferralMD’s customer results illustrate why the operational measures matter. In its published Baptist Memorial Healthcare case study, the organization reported a 33% decrease in referral processing time, a 98% decrease in time between sending a referral and scheduling an appointment, and an 11.5% increase in referrals processed per coordinator when comparing FY2023 with FY2024. Results will vary by organization, workflow, baseline, and implementation.
What Separates High-Performing Referral Programs?
High-performing programs treat referrals as a managed care pathway rather than a passive inbox. They review new referrals promptly, identify missing information early, verify requirements before the appointment, use multiple patient outreach channels, and escalate stalled referrals through defined workflows.
They also measure the full referral lifecycle. Volume tells leaders how much work entered the system. Completion, speed, leakage, and loop closure show whether the system delivered the intended result.
A connected referral operating platform can centralize work queues, automate status-based tasks and communications, integrate with existing systems, and provide real-time reporting. The goal is not simply to track more data. It is to help teams intervene earlier, improve patient access, strengthen provider relationships, and make better operational decisions.
Frequently Asked Questions About Referral Management Metrics
What is the most important referral management metric?
Referral completion rate is the clearest overall outcome measure because it shows whether referred patients received the intended care. It should be paired with time to first contact and time to schedule so teams can identify problems before completion declines.
How do you measure referral leakage?
Divide eligible referrals completed outside the preferred network by all eligible referrals, then multiply by 100. Use reason codes to distinguish avoidable leakage from patient choice, clinical necessity, unavailable services, insurance limitations, and geographic access.
What is a closed-loop referral?
A closed-loop referral is one in which the receiving provider acknowledges the referral, the patient’s status is tracked through the intended care, and appropriate results or status information return to the referring provider.
How often should referral KPIs be reviewed?
Operational teams should monitor aging referrals and service-level exceptions daily. Managers can review trends weekly, while leadership and network governance teams may review financial, access, and performance measures monthly or quarterly.
Which referral metrics matter most for ACOs?
ACOs should track referral completion, time to follow-up, network leakage with reason codes, closed-loop communication, access by specialty and geography, and variation across participating organizations. These measures help identify care-coordination and network-capacity gaps while preserving patient choice.
Ready to see where referrals stall? Explore advanced referral analytics and leakage control or request a ReferralMD demo.
Related Posts


Subscribe to Our Blog
Recent Posts